
My First Attempt At Systematic Trading Algorithms
 Photo taken at Waihee Ridge Trail, Maui
note: I republished this on HackerNoon.com
Recently I read the book Trend Following By Michael Covel which is a wealth of knowledge and interviews on systematic traders using trend following approaches. I was so swayed by the data in the book that I decided I wanted to explore more and build some trend following systems with the goal of beating the S&P500 in backtesting.
OK First, What is Trend Following?
Trend following is an attempt to take a advantage of a feature of markets: they trend. This means over periods of time a market moves consistently in one direction, rather than fluctuating randomly. In the book Covel backs this up with hundreds of years of historical data across many markets to prove it.
I think most people would agree that markets do trend. I think most people would also agree (if they really think about it) that the entire U.S. retirement industry is built on the presumption that US equities will continue to trend up forever. Covel actually brings this into question as well, which I think is laudable and worth thought.
So trend following is different from the strategy you are using in your retirement account, which is probably simply buy and hold. A particularly nice advantage of trend following is that is limits downside risk. So in 2008 a trend following strategy would have given you a sell signal and you would drawdown (lose account value) only 20% instead of 50%. It would also indicate you should “short” the market (bet against it) and you would actually make money. Although, you can do a more simple long-only trend following strategy too.
How does one “Trend Follow”?
Actually there are a lot of problems to solve here, namely, how do you find a trend? More specifically, how do you find a trend quick enough to buy into it, and how do you know when it is over so you can sell out of it before you lose too much money?
As it turns out, there are many ways to do this. The most common way probably being using moving averages or other well known indicators designed to find trends. A moving average is simple: you just average the last n periods in a market to get the current value. E.g. a 50 day moving average is simply the average of the last 50 closing day prices of a given market. This is a “Simple Moving Average” and there are many types of moving averages but all are based on this idea fundamentally.
In this blog post I am going to be using two sets of moving averages as the indicators, and when they cross I am going to use this as the buy or sell signal. This is the famous MACD (Moving Average Convergence Divergence). In fact in Covel’s book many people say they simply use moving averages and he includes a paper that outlines how a simple moving average cross system beats many buy and hold strategies.
OK, Second, How does one “Systematically Trade”?
Systematic trading just means you develop a trading strategy that is rules based. You follow the rules of the system and implement it. This is algorithmic trading, with your rule set being the algorithm. You can implement the system manually or you can write a computer program to do it for you. Being an engineer I want to automate things and develop systems that make the right decisions without human input. So obviously I want to automate my system.
The other advantage of automating your trading system is that it takes the temptation to override it away from you. Complete automation forces you to adhere to your system. I am an experienced investor but not much of an active trader, so it is very advantageous to avoid this possible pitfall.
Quantopian is a company that gives you a platform to build and backtest trading systems. Everything is in python and they have data for a lot of markets that goes back pretty far. I started out using Quantopian, but I ended up switching to QuantConnect, which is similar but actually has live trading. For a monthly fee QuantConnect will let you trade your algorithm live against your Interactive Brokers account. You can write your code in either Python or C# here.
What is the end goal?
My goal is to actually develop a good system that will trend trade several markets at once and trade it live! Here are my general goals, broadly speaking:
- Beat the S&P500 over every 5 year period in backtesting
- Never have a yearly drawdown more than 25% (S&P500 routinely sees 50% drawdowns)
- Have a Sharpe Ratio of greater than 1 (outside of the scope of this post).
- Be exposed to many different markets (not just US equities primarily, which I am now)
- Have a strategy so general that is performs OK in nearly every market
The last goal is very important. If you are familiar with data science or machine learning you will have heard of “overfitting”. If my strategy is so optimized that all it can do is beat backtests it will likely fail in the future because I will have effectively data mined the historical information to over-optimize it. So avoiding overfitting is key!
Let’s get going. Here is the basic strategy.
As I mentioned before I am going to use moving averages. Specifically I will be using Exponential Moving Averages and look for a crossover between a short and long moving average period. An exponential moving average is similar to a simple moving average except that it is weighted to favor more recent time periods so you can pick up trend changes faster. In the chart below I plot two moving averages at different time periods and we can see them cross.
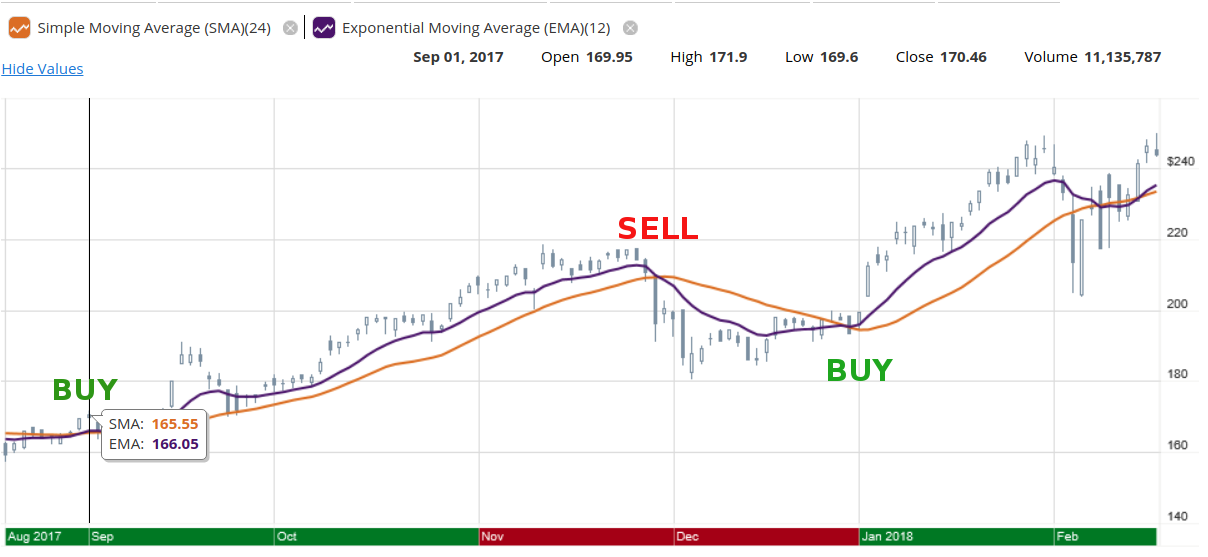
The above is a chart of Nvidia stock over the past couple of months. I plotted a short exponential moving average and longer simple moving average. You can clearly see the crossover points occur and the trend change direction. When the shorter period is on top you buy, when the longer period is on top you sell. I have the crossovers marked with “BUY” and “SELL”, you can see how this would be profitable. It doesn’t always work out that nicely, and the market doesn’t always trend, but in trending markets this works well.
To be clear I may not end up using these indicators. But the following are experiments using the the Exponential Moving Average as an indicator or “EMA” from here on out.
First Backtest: Moving Avg Crossover against ONLY SPY.
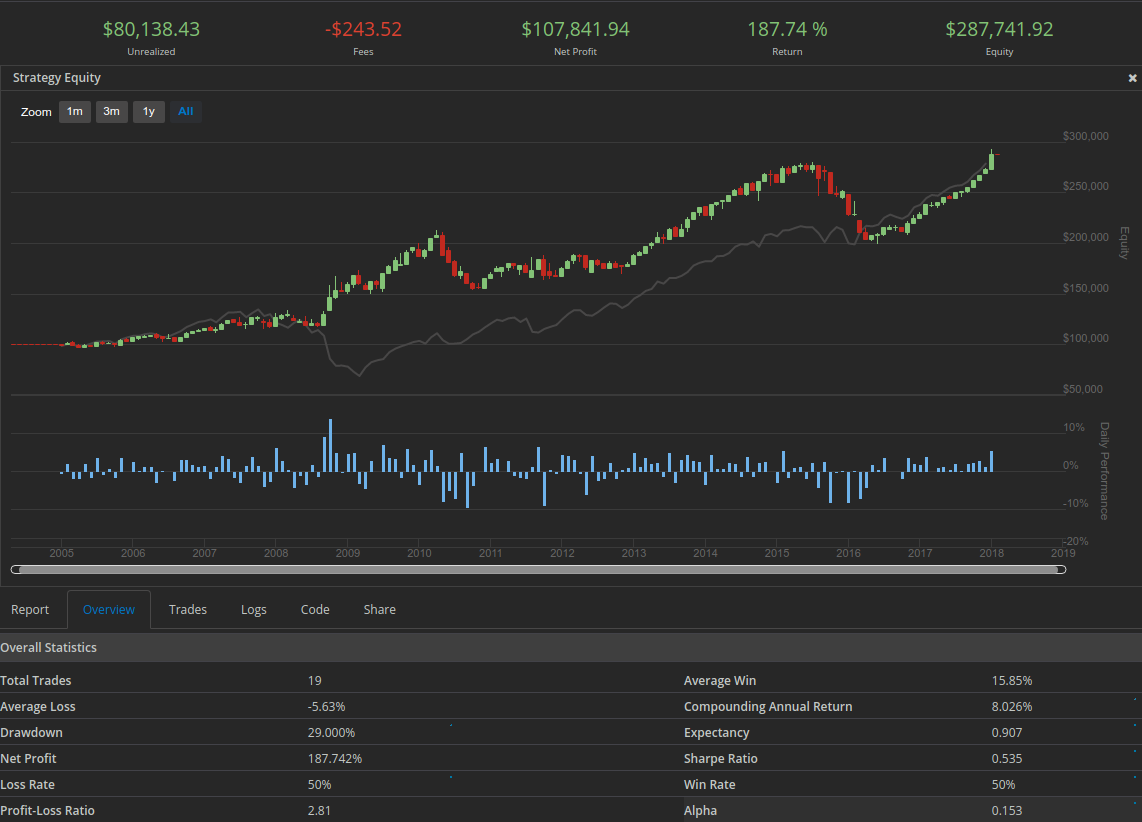
SPY is an ETF that tracks the S&P500. S&P500 is my benchmark to beat. So I want to first ensure that I can beat SPY alone just by trend trading. Short period is 50 day EMA. Long period is 150 day EMA. No leverage. Long and short. Code is here.
Results: a good start
Actually this is a good start: we kept up with the benchmark and suffered a 29% drawdown at the worst. Sharpe Ratio is only 0.535, we can do better.
SPY Only MACD, 50/150 Long only
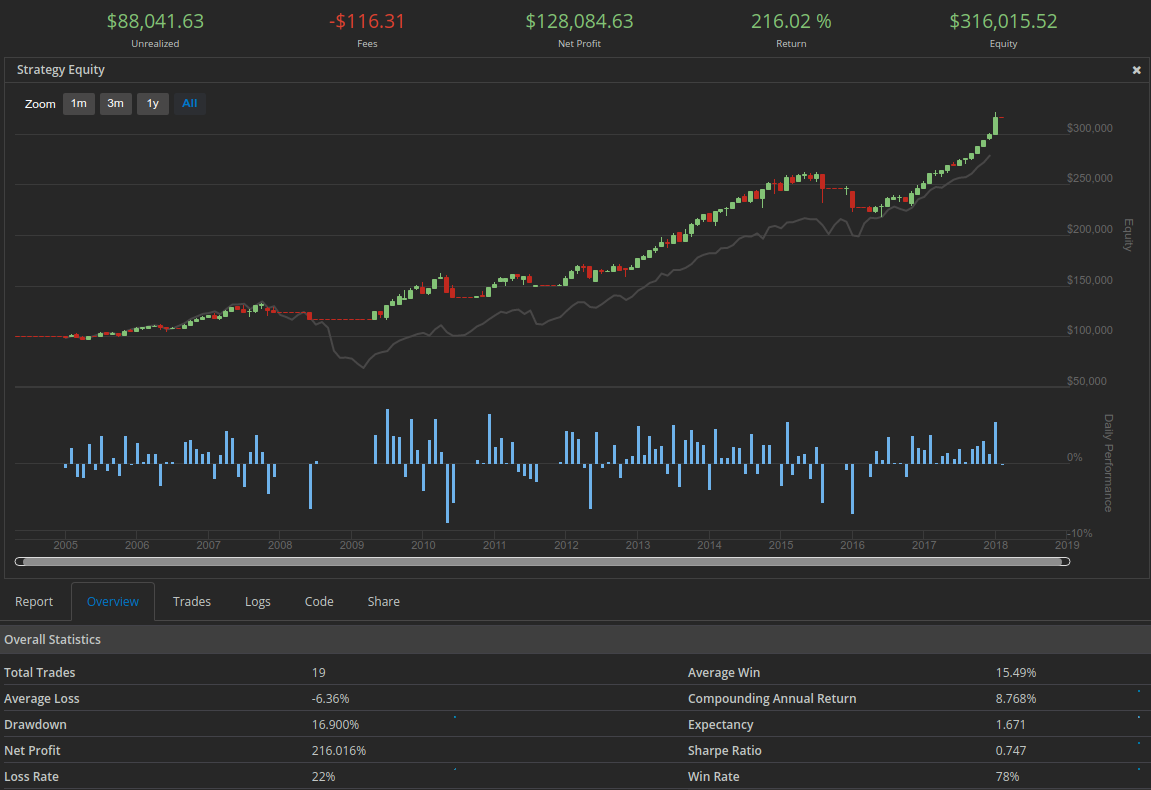
We are now going to do the same thing as above but just long only. That means no shorting, we just exit the market entirely when the trend is down. Everything else is the same (same code I just change “longOnly” to “True”). You can clearly see in the chart in the period of the great recession where we exit the market and no trading takes place.
Results: greatly reduced drawdown, improved Sharpe ratio
The result is interesting: the 2015/2016 period was very choppy and confused the moving average system. By not going short we saved ourselves a lot of pain here. Sharpe ratio is a measure of risk adjusted return - so since our volatility decreased sharpe ratio went way up. This system actually beat the market a bit.
SPY Only MACD, 50/150, Long only, Adding leverage
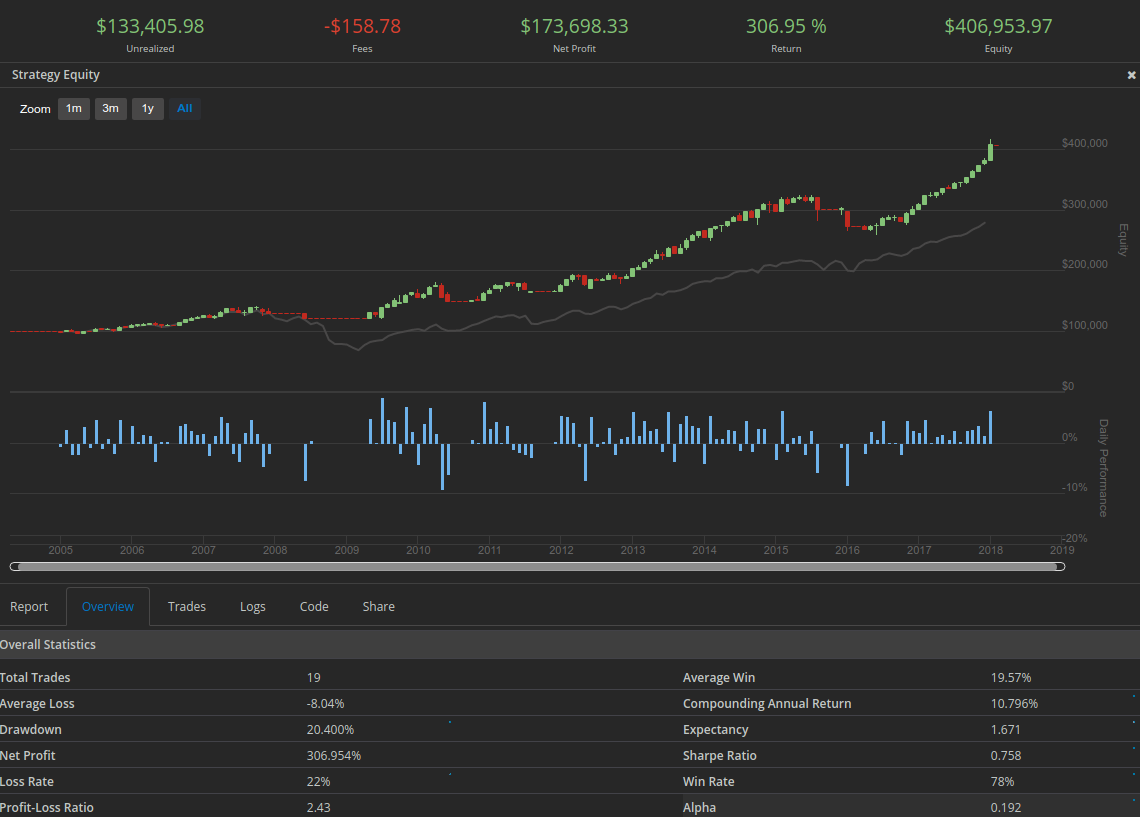
We keep everything the same as above but we will add a bit of leverage. We will buy on margin at 1.25 ratio. So 25% will be borrowed. This will increase returns if the system is good, but it also increases risks.
Results: really beating the market now
So you can see from just a little bit of leverage (which we pay for), compounding annual return is greatly increased to 10.8% almost. Can we do even better?
SPY MACD, 50/150, Long Only, x1.25 leverage, hold TLT in downtrend
We will slightly modify the algorithm now. I am going to have the system hold TLT (a treasury bond etf) which will pay us some interest while we wait for SPY to return to an uptrend. TLT should also be weakly inversely correlated with equities so it may increase while SPY goes down. Note that TLT is not purchased with leverage. Here is the updated code
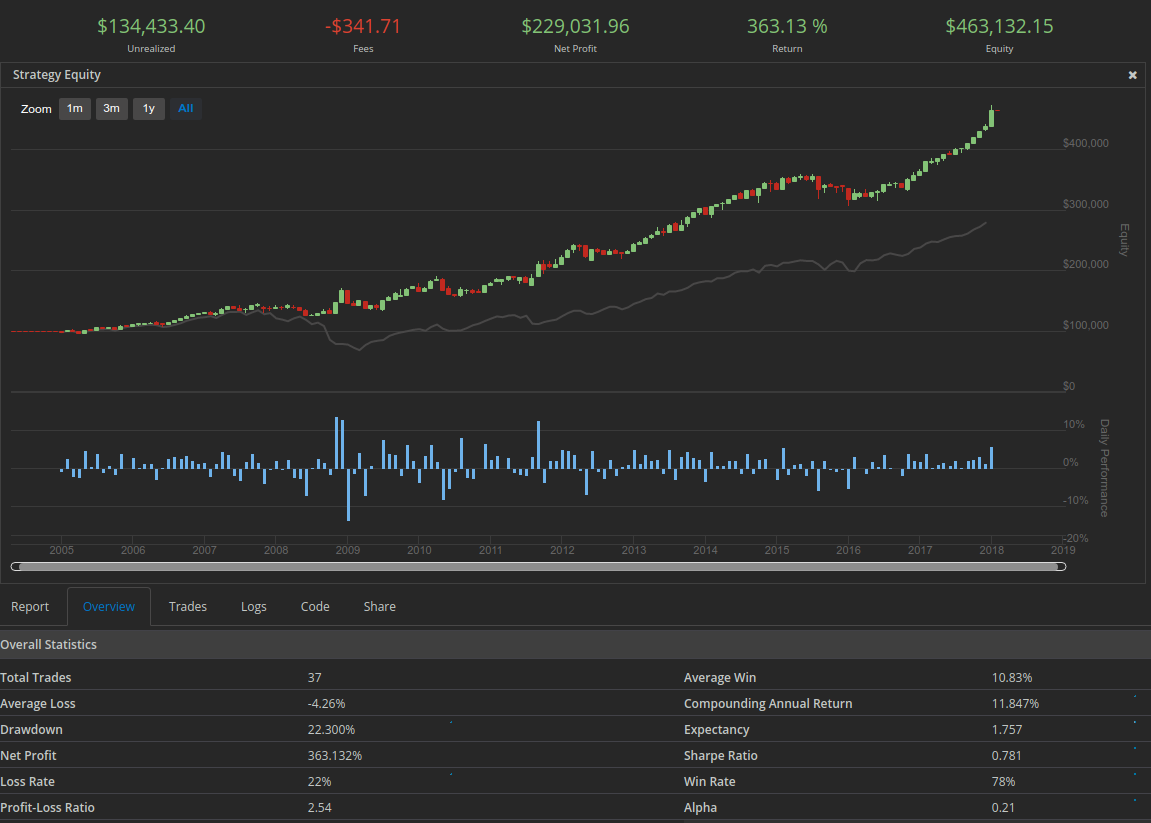
Results: every metric is increased
From simply holding treasury bonds while we are out of the market our returns are greatly enhanced. Compounded annual return is up to 11.85% which beating returns for the S&P500. This is starting to hint at the magic of trend following. What if we hold something else in a strong uptrend? What if we can measure the strength of the uptrend and always be in the strongest trends? Regardless, this simple 2 ETF strategy seems to work very well if the market is a trending market.
CVX, DE, CAT, F - Trend Trade
We are going to try something different now. I am going to keep leverage metrics the same and the EMA cross signal the same 50 / 150. But we are going to trade a couple of cyclical stocks. Chevron (an oil company that drops when oil drops), Deere and Caterpiller are cyclical and tied to construction and agriculture, and finally Ford which is the definition of a cyclical stock.
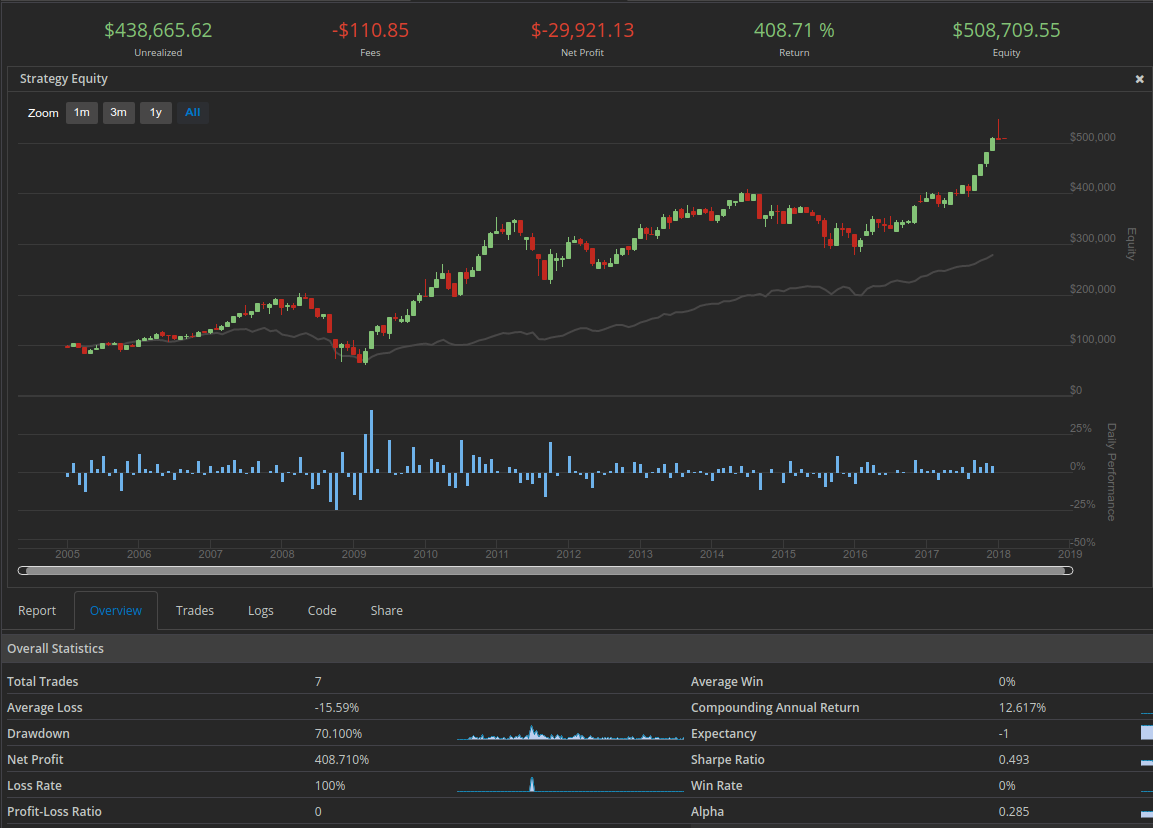
Plain old buy and hold benchmark of these 4 stocks:
Trend trading these 4 stocks
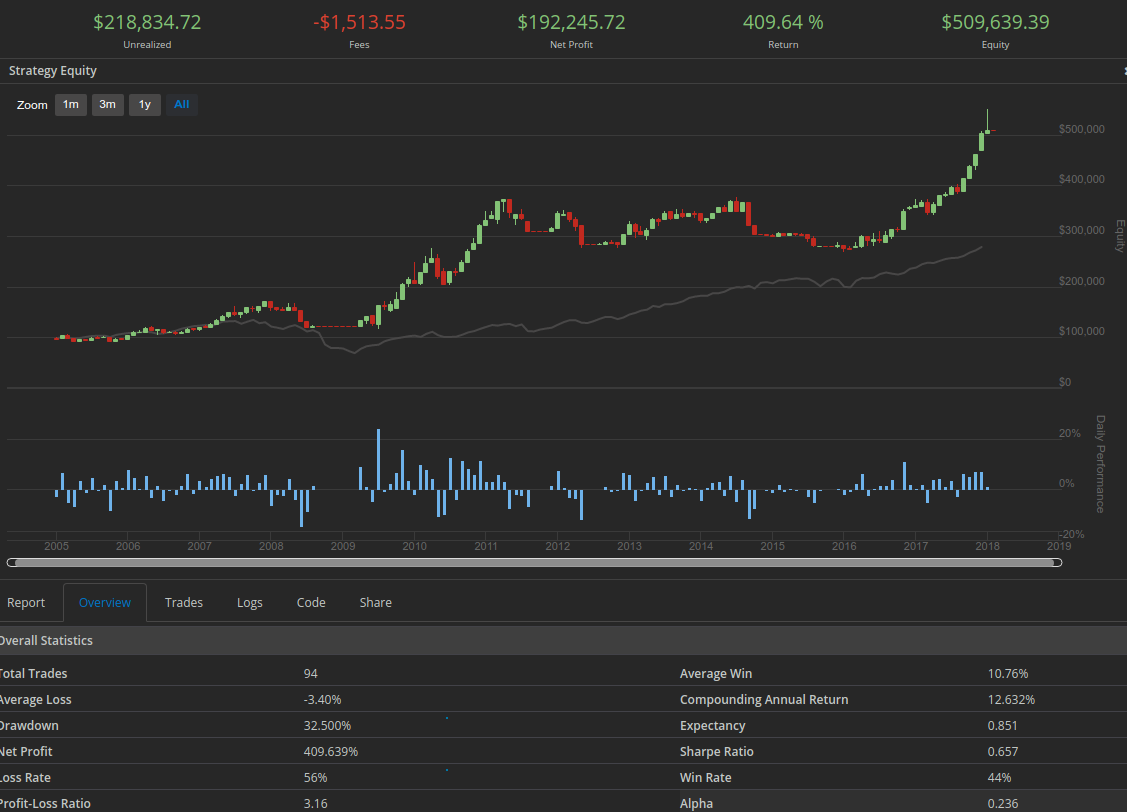
Results on trading cyclical stocks
So the algorithm didn’t have any alpha but it didn’t underperform. Even with the fees from the churn it did alright. One massive advantage was that we minimized the max drawdown a lot. Buy and hold lost 70% in one year, while our trend trading system only lost 32.5%. So how could we optimize this more? Well, I didn’t do the buy TLT trick when things were not trending. Even better I could have overweighted the trending stocks so that all of the cash was always being used and always being deployed in an uptrend. Or I could have gone short. I could also optimize the EMA periods a bit more based on the volatility of the stock. I’m going to work on some of these optimizations for the next post.
Conclusions
This is just a quick summary of my initial explorations with trying to build a dirt-simple trend following system. I will have more to follow up with this soon, but first I want to talk a bit about what we could learn from this exploration.
-
MACD 50 day short and 150 day long periods are good for SPY. I didn’t show it but I tried a few other periods and shorter EMA periods didn’t work too well. This makes sense because SPY is an index, it is a composite of 500 stocks. The signal is already pretty smoothed, so it won’t switch trends very fast. Maybe if you trade a single tech stock you can use a shorter EMA period. Perhaps it doesn’t make sense to trade an index at all since we are really hoping for volatility.
-
It only works if the market is trending. See that 2015/2016 period where the market just chops sideways? Yeah, trend trading is no good when there is no trend. The trick may be to measure the strength of the trend and then figure out how to only trade in markets with “strong” trends (however you define that).
-
If you add leverage it works even better. Because you are riding the big trends, the majority of the time you should be moving up with the market. It seems rather safe to use leverage. Covel talks about trend traders in his book using leverage commonly so this seems to be a valid conclusion.
-
Long only works well on equities. Equities tend up over the long term so long only maybe works pretty well. Much of Covel’s book deals with commodity markets though, which are cyclical and don’t trend up over the long term. So it makes sense to go short with other markets, but maybe not equities, since the markets seem to only temporarily go down. I think it is important to remember that over the long run US Equities are a bet on the US economy as a whole.
-
It will take a lot more work to intelligently trade many assets simultaneously. Just simply buying and holding in equal allocations is not very smart. We have to be smarter if want to efficiently use capital. How can you identify the strongest trends and only buy into those? How can you avoid chop in the market? What should you do if you find that nothing is trending?
-
Even if you don’t get any alpha, drawdown is minimized. It is a pretty big advantage to avoid massive drawdowns during recessions. Trend following is pretty cool in this respect alone in that it preserves capital much better than buy and hold.